
 Customer Lifetime Value or CLV (aka CLTV or LTV) is an essential SaaS metric for quantifying the present predicted value of a revenue stream from a customer. Understanding the Customer Lifetime Value is crucial for understanding how much is prudent to spending on customer acquisition. It is a method of determining the value of the business based on the unit economics of increasing the customer base. It also dramatically shows the cost of churn and can justify additional resources spent to decrease churn by showing the impact on customer value.
The sum of the Customer Lifetime Value of all the company’s customers is the “Customer Equity” – an important measure of the company’s value.
The Customer Lifetime Value metric also provides a method of comparing the economics of the traditional licensed software model (with high initial revenue) against the SaaS subscription revenue stream. The comparative value of these two revenue streams is contrasted in the article “SaaS Revenue Models Win in the End.” The CLV formula provides a means of comparing the value of customers between the two competing revenue models.
While CLV is a crucial metric for running and assessing a SaaS business, different methods of CLV calculations yield widely different values hardly giving confidence in the metric. Beyond the required churn and subscription revenue mandatory components of CLV, different formulas include or omit key determinants of the Customer Lifetime Value including the cost of capital (interest), the cost of providing services to the customer, and the cost of customer acquisition. Additionally, since CLV is predictive, the value depends entirely on the ability to forecast future revenue and costs. As additional insights into customer behavior are understood, more sophisticated CLV models may be used to improve its accuracy.
This post describes multiple methods of computing CLV from the least to the most complicated to help determine the most appropriate CLV formula for the stage and complexity of the business.
1) Simpleton’s Customer Lifetime Value Formula
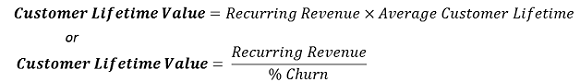
The Customer Lifetime (the average theoretic life of a customer) is:
![]()
“Everything should be made as simple as possible, but not simpler” A. Einstein
Revenue Churn is defined as the amount of recurring revenue lost from churn versus the total recurring revenue earned during a period. For the purposes of computing the Customer Lifetime Value, we always use Revenue Churn since the number of the customers who churn is not relevant to the calculations, but only their lost revenue (unless all customers have the same recurring revenue).
With an average 10% annual churn, the average age of a customer would ultimately be 10 years.
Customer Lifetime Value in its simplest, least useful form, is equal to the Recurring Revenue times the average Customer Lifetime – the average length of time a customer is a customer times the recurring revenue.
The greatest deficiency of the simple form of CLV is it values a dollar received in 10 years the same as a dollar received today. The second issue is neither the churn nor the recurring revenue is likely to be constant over the life of the customer. However, the simplistic CLV dramatically shows the impact of churn.
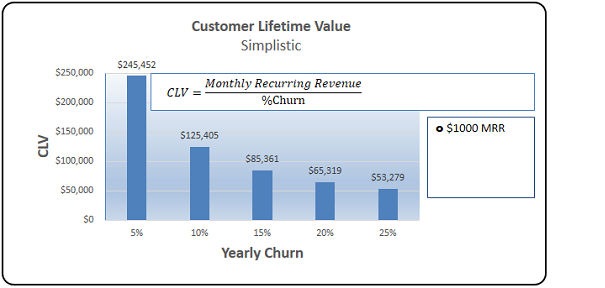
So we all understand churn is really really bad…
2) Minimum Viable Customer Lifetime Value Formula
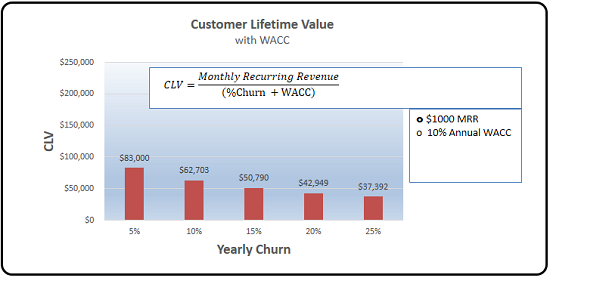
We should “discount” (reduce) the value of revenue received in the future versus the value of the revenue received in the near term in the Customer Lifetime Value calculation. This is easily, though not frequently done by incorporating the “Weighted Average Cost of Capital”, WACC (interest rate) to reduce the value of future revenue in the CLV.
The WACC rates used vary substantially. For startups, capital is expensive – with perhaps 16% interest if you can get it. For large companies, cash may be obtainable for a much lower rate, but every company values cash they have more than cash they may get in the future.
A 10% WACC value can be used as a placeholder until an interest rate appropriate for the business is established. The discounted “Minimum Viable Customer Lifetime Value” is much more accurate than the Simplistic CLV where there is an implicit WACC (interest) rate of 0%.
By discounting the future earnings by the WACC interest, this CLV calculation more realistically shows Customer Lifetime Value.
A bird in the hand is worth two in the bush
– don’t count future revenues the same as current revenues
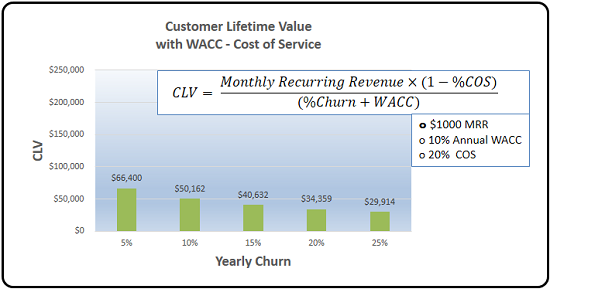
3) Customer Lifetime Value after Cost of Service
Customer Lifetime Value should also deduct the Cost of Service to reflect the gross profit of the customer, not just the revenue stream. Since the Cost of Service may not be known (or predictable) not all CLV values include the Cost of Service – it should be clear in the explanation of the CLV value, whether it does or does not include Cost of Service.
Cost of Service should always include the SaaS hosting, SaaS operational costs, and customer support which are required to provide the service to the SaaS vendor’s customers. The benchmark for Cost of Service for SaaS is 15% to 20% of the recurring revenue. Both NetSuite and Salesforce have a SaaS COS of 18%.
It’s not the money you make, it’s the money you keep…
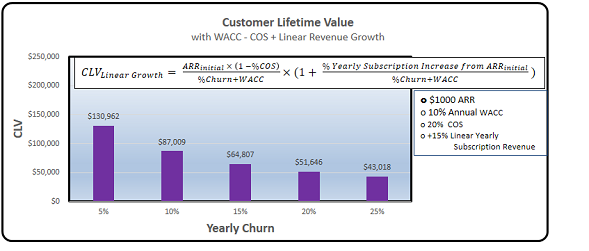
4) Customer Lifetime Value with Increased Revenue
Maximizing the Customer Lifetime Value is dependent upon the ability to increase the sales into the organization, increasing the price of the SaaS subscription, and reducing the churn. That a customer will have the same subscription revenue for their entire life is contrary to the SaaS “Land and Expand” mantra. The subscription revenue for customers should be increasing with additional up-sells (more of the same products) and cross-sells (selling different product to the same customers).
B2B SaaS vendors potentially have the potential to increase subscription pricing every year reflecting both inflation and the subscription value increase as new features are added. The ability to increase subscription pricing is dependent on the competitive positioning and the absence of product commoditization.
David Skok refers to the increasing value of the customer as “Negative Churn” – the value of the prototypical customer decreases with churn, but rises with the potential subscription revenue increases. It is ill-advised to assume that the revenue from a customer will increase indefinitely, but is illustrative of the potential CLV. Planning for subscription revenue increases can show the potential for increasing the CLV through up-selling, cross-selling and subscription price increases.
Modeling the impact of up-selling and cross-selling on the CLV can be done using one of three methods:
a) Linear Revenue Increases each period (aka arithmetic growth)
e.g. each period, the customer revenue increases by $1000 dollars
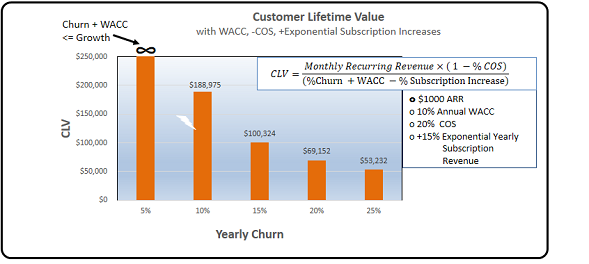
b) Exponential Revenue Increase (aka Geometric growth)
e.g. each period the revenue increases 10% over the prior period.
c) Specified Revenue for each period
All of these methods which have constant increases for all time are valuable as a first approximation, but clearly these trends will not last indefinitely. Section “5) Customer Lifetime Value with Varying Inputs” covers the more accurate scenario where there is a non-continuous change in the inputs to the CLV model.
Land and Expand!
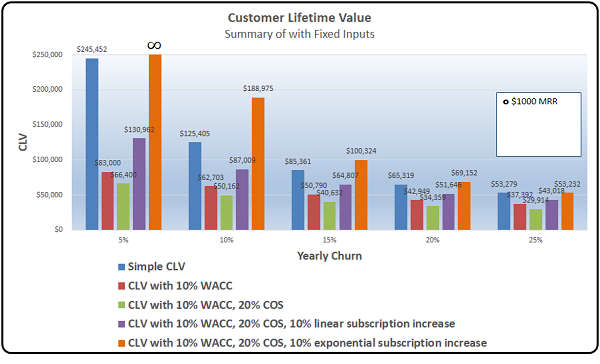
Summary of Fixed Input Customer Lifetime Value Methods
The addition of additional inputs to the CLV formula improves its accuracy (assuming the parameters are somewhat accurate). Using different values to the CLV formula gives very different results:
Choose your Customer Lifetime Value method carefully!
5) Customer Lifetime Value with Varying Inputs
The proceeding examples have a fixed churn, revenue, and WACC values for the life of the customer. While this is a simplifying assumption, these values will change over time. Initially, without customer behavior data, it is difficult to predict the trends, so using fixed values in the CLV equation may be the only feasible method of producing an approximate CLV value.
Some macro trends can be forecast that are achievable for SaaS companies as they mature. As experience is developed as the customer base ages, these trends can be codified to assist in making the CLV model more accurate.
The formula for CLV when you can forecast the revenue, churn, Cost of Service, and WACC for each period, n is:
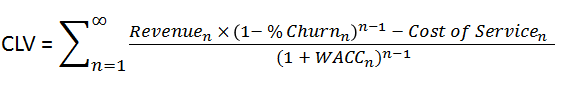
CLV models will typically use an Excel financial model to forecast changes as 1) the company’s KPIs improve and 2) the future value of their customers increases with time. Paradoxically, after a customer has been a customer for a while, their future value exceeds that of a new customer as older customers have a lower rate of churn. The variations in these inputs to the CLV formula are discussed below:
WACC Variability
The WACC may change over time due to both the changes in the economy and of the circumstances of the company impacting the interest the company must pay. This is difficult to predict so typically forecast WACC rates are kept constant.
Churn Variability
Early in the life of the customer when they are “trying it out” churn rates can be quite high – once a customer starts using the SaaS product extensively they are much less likely to churn. Churn rates should decrease over time as the SaaS product is fully embedded in the customer’s operation. More sophisticated SaaS financial models will account for this change in churn of longer term customers. This Cohort of customers (a group of customers with similar characteristics) of the same length of time as a customer will have similar churn characteristics. Other Cohorts of customers (such as by sex, age, income level, etc.) will have different CLVs.
After a period of time, new competitors and alternatives can emerge in the market, disrupting the company’s business model causing churn to skyrocket (think Blackberry).
 Cohort Churn Trends – David Skok
Up-sell & Cross-sell
The successful SaaS company should be driving to expand the usage and hence the subscription revenue within each of its customers. SaaS companies with usage based pricing will see automatic revenue increase from their customers increasing their usage. Ideally, this should continue until the customer’s use of the product is saturated within the future up-sell revenue growth of that customer.
SaaS companies should be building new products to generate new revenue streams within their customer base. The new product revenue can be (cautiously) forecast into the CLV potential of the customer.
Adjusting the CLV formula to account for changing subscription prices, additional up-sell/cross-sell revenue, and churn rates provide a more accurate CLV assessment while requiring more complexity and detailed forecast of future rates.
Subscription Price Increases
The ability to increases the subscription price is an important part of increasing the Customer Lifetime Value. The price of the subscription in fixed for the duration of the B2B SaaS contract term, but then may increase.
The ability to increase the SaaS subscription price is dependent on the ability of the SaaS vendor to increase the value of the SaaS subscription year after year to the extent that the product category doesn’t become commoditized (think any market Google enters).
Cost of Service Decreases
Early in the life of a SaaS product, the Cost of Service will be high. Legacy on-premises products may not be optimized for SaaS for capabilities such as multi-tenancy enablement. Higher use of the computing infrastructure will result in economies of scale of both computing and personnel costs.
World Class SaaS companies will have a Cost of Service less than 20% including hosting, administration, and customer support – NetSuite and Workday both have a Cost of Service of 18% of their SaaS. A higher Cost of Service should be analyzed to identify the root causes of these excessive costs, a plan to reduce these costs should be implemented, and the reduced costs should be reflected in the CLV model.
Additionally, the IaaS cost/performance of computing and storage improves about 10% to 15% per year. These favorable trends will increase the CLV and improve the company’s profitability.
Summary of Variable Input Customer Lifetime Value Inputs
As the length of time a customer is retained as a customer increases, generally their likelihood of churn decreases, the opportunity for upselling additional subscriptions increases, and ability to raise subscription prices increases in non-linear ways. Using the SaaS companies experience and trends from other SaaS vendors in similar markets, these trends can be reflected in a Customer Lifetime Valuation model.
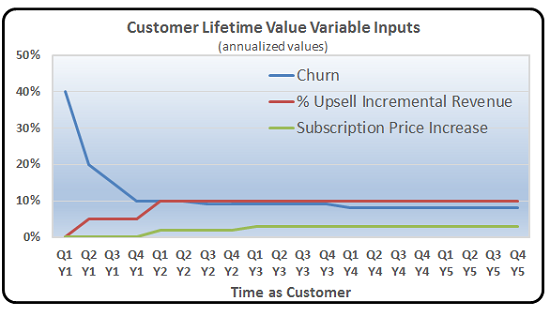
Building these CLV models with variable input specified on a quarterly or annual basis will provide a more accurate CLV forecast.
Additionally, as the SaaS company matures, the Cost of Service should decline (independent of the age of the customer) further increasing the Customer Lifetime Value.
Customer Acquisition Costs Relationship to CLV
Customer Acquisition Costs (CAC) is one of the key determinants of the success of a SaaS business. Most SaaS luminaries do not include CAC as a negative input into the CLV (David Skok), but some do (Bill Gurley). Onboarding costs are usually included in the Customer Acquisition by public SaaS companies such as Constant Contact.
The ratio of Customer Acquisition Costs to Customer Lifetime Value is a key metric of SaaS vendor health and described in detailed in the upcoming post “SaaS Business Models Win in the Long Run” (click here to subscribe to our blog).
Conclusion
The Customer Lifetime Value is a valuable tool to predict the value of a customer. Different methods of calculation CLV gives more accurate results based on the certain of the variables in the equation, but CLV should never be used without discounting for the value of money – the WACC.
The Cost of Service (COS) should also be included in the CLV, or at least, the omission of COS should be highlighted. If the COS is greater than 20%, the SaaS vendor should aggressively work to decrease their costs.
SaaS customer value increases through greater subscription revenue per customer should be considered as upsides to the baseline CLV values. The ability to increase the subscription revenue from the customer base should be based on empirical evidence of the customer growth cycle over a limited period of time. These increases in customer value are appropriate for management objectives, but should be used with caution for company revenue growth commitments.
It is imperative to know which measure of customer value is used as the actual Customer Lifetime Value varies dramatically based on the method of calculation and the key drivers of value used as shown below for CLV formulas with fixed inputs:
Customer Lifetime Value models based on varying the key inputs of churn, subscription revenue, costs of service and WACC rates (interest) should give greater accuracy to the CLV results as the trends in these key inputs are understood.
Recommendations
SaaS vendors should progress in the use of Customer Lifetime Value to more sophisticated methods as they increase their understanding of their customer’s patterns and their costs.
Phase 1 – Use CLV with WACC and a Fixed Cost of Service
With limited knowledge of trends in the inputs to the CLV calculation, fixed values should be used. While the ultimate target for B2B SaaS companies should be no less than 10% annual churn and a Cost of Service of no more than 20% of SaaS revenue. Churn is likely to initially be higher than 10% until the product market fit is refined. Early Cost of Service is likely to be closer to 30% of revenue until software efficiency, operational efficiency, and economies of scale improve as the company progresses.
Phase 2 – Create a Target CLV with Attainable Revenue Increases and COS Decreases
A “what-if” scenario anticipating yearly revenue increases from annual subscription price increases, SaaS revenue (up-sell/cross-sell), and decreased Cost of Service may be generated. Of particular importance is understanding the “sensitivity” of improvements in these factors in both the Customer Lifetime Value and the SaaS business’ financial model.
Phase 3 – Build a CLV Model with CLV Inputs by Year
The most accurate CLV model will be based the key parameters (churn, up-sell, etc.) specific by year. As an addition degree of precision, these should also reflect the changing of behavior based on the age of the company – particularly, the churn ratios should decrease as customer’s age.
Using Customer Lifetime Value
CLV is a crucial metrics, but it is only a tool to better manage a business. Different customers have vastly different CLVs depending on the “cohort” they belong to — some customers generate a lot more value than others. The sum of the CLVs of all customers equals the company’s Customer Equity. Realizing differences in CLVs and focusing resources on increasing the CLV and hence the company’s Customer Equity is essential to the healthy SaaS businesses.

